Regression Analysis
Advertisement
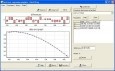

Equation Plotter - EqPlot
Graph plotter program plots 2D graphs from complex equations. The application comprises algebraic, trigonometric, hyperbolic and transcendental functions. EqPlot can be used to verify the results of nonlinear regression analysis program. Graphically
Advertisement
GraphSight v.2.0.1
GraphSight v 2 is a software for math graphing solutions that has curve fitting capabilities. GraphSight 2 is perfect for high school and college math students. This utility is feature rich and comprehensive.
XLGENLINE v.1 1
XLGENLINE is an Excel-based software program that allows the user to perform generalised least squares (GLS) regression analysis that is fully compliant with the International Standard ISO 6143.

EqPlot v.1.3.22
EqPlot plots 2D graphs from complex equations. The application comprises algebraic, trigonometric, hyperbolic and transcendental functions. EqPlot can be used to verify the results of nonlinear regression analysis program.

Equation graph plotter - EqPlot v.1.3.33
EqPlot plots 2D graphs from complex equations. The application comprises algebraic, trigonometric, hyperbolic and transcendental functions. EqPlot can be used to verify the results of nonlinear regression analysis program.
Linear Regression v.1.0
Performs linear regression using the Least Squares method. Determines the regression coefficients, the generalized correlation coefficient and the standard error of estimate. Does multivariate regression. Displays 2D and 3D plots.
SYSTAT v.13.0.05
SYSTAT is a versatile and comprehensive statistical software package. It employs a staggering range of powerful techniques to help conduct many types of research. SYSTAT Offers All the Statistical Computing Power That Researchers Need.
Leverage v.1.1
Study the leverage effect with this tool. Leverage enable you to experiment with the leverage effect. You can create a random sample of data noisy points on a line. Dragging one of the points away from the regression line,

QMSys GUM Enterprise v.4.9
QMSys GUM Enterprise is a comprehensive software tool for analysis of the measurement uncertainty of physical measurements, chemical analyses and calibrations.
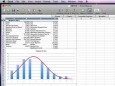
StatPlus:mac v.2009 5.8.3.7
Perform statistical analysis on a Mac in the familiar environment. Turn Microsoft Excel 2004 or 2008 into a powerful statistical package with StatPlus:mac. Stop wasting time learning new tools and perform complex statistical analysis right away!
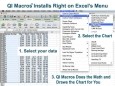
QI Macros SPC Software for Excel v.2016-08
Affordable, easy to use SPC add-in for Excel draws pareto charts, control charts, histograms, box and whisker plots, scatter plots and more. Just select your data and then select a chart from QI Macros menu. Automated fishbone, statistical tests too.